skip to main |
skip to sidebar
Yes, what about filtering?
It's nice to have metrics (and XStudio provides a lot of them) but it's even better to extract some data under specific focus. And nothing's best than filtering and sorting to dig through large list of items.
Hence XStudio 2.0 includes a new simple but very effective/powerful filtering/sorting mechanism.
Here is how it looks like for instance when you select a SUT and get all the latest results obtained on this SUT (test and test case levels):
On tests, you can filter items based on ANY columns.
This includes the optional columns that you may add to the grid:
At test case level, you're able to add columns corresponding to the custom fields you defined.
Of course you can also sort (ascending or descending) the items by just clicking on the header of a column. Of course, the sorting applies on the filtered output.
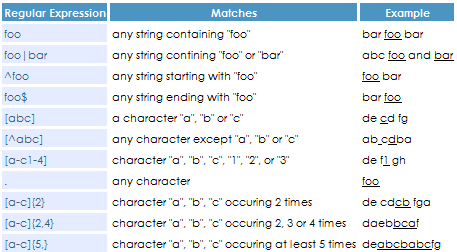
Note: the filtering on string uses the very powerful Regular Expression syntax. This allows defining some very complex searches but also simple ones using some basic syntax such as:
Getting the results from many test campaigns is good but what would make a real difference would be the ability to compare those results in regards to the context in which they were obtained. And this to maybe deduce some interesting facts. In particular, what makes some tests failing...
Is it...
1) the agent/computer type on which the tests have been executed? If you execute the same campaign on a computer under Windows XP, another one on Windows 7 and another one on Linux or MacOSX and you see that all the campaigns executed on MacOSX have much more failure it probably means something right?
2) the operator who performed the tests? people may interpret the test script differently and this may affect seriously the results.
3) the configuration/environment in which the tests have been performed?
XStudio 2.0 will provide a very convenient way to compare results obtained based on those criteria through a very simple reporting interface:
One small details one may notice in XStudio 2.0 (to be released soon) is that progress bar are flattened. This is just a small detail... but it makes reporting much cleaner (especially on Windows XP):
For those using Windows 8, you'll probably notice not much as this look'n feel is pretty much the same as Windows 8's style.
Campaigns and campaign sessions are ideal to follow results "per run". Consolidating can be done by using the very useful merge feature.
But starting with 1.9sp4 there is an even simpler way to track the latest results on each SUT (or campaign): just select the SUT or the campaign and open the Results tab.
Everything is there:
When you run a test campaign (actually a campaign session) in XStudio you get results. Good.
If you want to change a result (for any reason) you have several choices:
- create a new session including the test you want to re-run and execute it
- have XStudio create for you automatically a campaign inlcuding all the tests (from a selection of several already executed campaign sessions) having a specific results
- select the test from the test tree and execute it from here
In all these cases, if you wish, you can merge the results with the ones from other sessions.
If this is about manual testing and you're using the tabual manual launcher, you can simply run again the same session and just change the result from the GUI.
BUT... what about just changing the result directly from XStudio without having to re-execute anything?
It's now possible in 1.9sp3.
Check out this video
... or look at the following screenshots:
XStudio uses A LOT of graphics and charts.
We improved our library so that it now always use the same presentation when it's about displaying charts (line, stacked, percentages, pie etc.). One of the most visible change is the way we present line charts. The new common presentation improves a lot the understanding of the figures behind.
Have a look at the following screenshots:
One of the improvement in the next version of XStudio (1.8) will be enriched testplans. When you generate a "paper" testplan, all the graphics you get in XStudio's GUI will be included.
For instance, if you generate a testplan from the root node of the test tree in XStudio you will get something similar to this in the graphics section of the document:
This includes data about the history of the results obtained from those tests, dependencies between tests and functional coverage.
If you generate a testplan from a test category:
This includes data about the history of the results obtained from those tests, the history of how much were automated and functional coverage.
If you generate a testplan from any folder containing tests:
This includes data about the history of the results obtained from those
tests and functional coverage.
The Procedure Tree is extremely powerful because of its recursive aspect when it's about verifications (you can specify complex boolean expressions including several verifications). When verifying algorithms or APIs it is definitely the best way to optimize execution time as useless verifications will be skipped.
However, we noticed many people were just using the test case description field to script their scenario. This is much simpler and flexible because of the formatting tool but the drawback is it misses the detailed structure of a step/verification model.
We added in XStudio 1.8 a new editor allowing to write test case scenarii in a simple 2 dimensions grid (Excel-like). We called it the Procedure Grid.
Hence, you'll have 3 options:
- use only the test case formatted description field (for simplest scenario)
- the description field + the procedure tree (for the most complex verifications/decision tables)
- the description field + the procedure grid (for the usual cases requiring a detailed but flexible script)
Here is the current version of the Grid Editor:
 A toolbar will allow to easily:
- move a step (with its expected results) up of down
- delete a step
- insert a new step before or after the selected row
As you can see, we also added the possibility to format the content of a step or an expected result (with the usual bold, italic, underline, list, tables etc. styling). For now the tags needs to be written manually though (the toolbar will come in a future version).
It's also easy enough to move through the cells using Ctrl-Tab (to go forward) or Ctrl-Maj-Tab (to go backward) (the Tab key can be useful in the text content itself hence the usage of the Ctrl modifier key).
It will be possible to choose the Tree or the Grid editor per test case and just clicking the other radio button will convert "at best" the current scenario - i.e. when switching from Tree to Grid, all the Checks in the boolean expression will be automatically converted in one simple Expected Results cell.
A new option has been added to the Settings to specify the default editor.
The "Use description as testplan" check box has been removed as it became useless (whatever launcher you're using, the description + the procedure are shown to the user).
The manual launchers have also been modified to take advantage of this new presentation. For a test case that has been described using the Grid Editor, at runtime it will look like:
 The tree editor has also been improved to accept formatting tags. CR/LF are also now accepted in the steps, parameters and checks (but will not be rendered as a tree node must fit one single line):

The rendering of the tree test cases has also been modified to be consistent with the grid test cases:
 Of course the usage of Params (to feed the test case with data from a dataset) is still possible (and advised) in any part of a test case description (description field, step, parameter, check, expected result).
Hope you'll like it!
Of course the usage of Params (to feed the test case with data from a dataset) is still possible (and advised) in any part of a test case description (description field, step, parameter, check, expected result).
Hope you'll like it!


