I'm seeing many ways to "implement" risk-based concepts but I have the following requirements and constraints:- make it simple enough so that people actually use it
- provide a certain level of customization
- must be mapped on XStudio's data-model which is basically:

Now, here is what I’m thinking of:
Business Requirements:
For each requirement, the user will have to provide:
a) a "probability/frequency" P value (between 1 and 5)
b) a "consequence/cost" C value (between 1 and 5)
Then each requirement have a computed "business risk" Br=P*C (between 1 and 25)
Technical Specifications:
For each specification, the user will have to provide:
a) a "technical risk/complexity" R value (between 1 and 10)
Tests:
The system will parse the graph linking each test to its related specifications then its related requirements and will compute a "criticality" Cr value based on some calculation:
Not sure what is the best formula yet though.
(A and B are user-customizable constants.)
Formula#1: no requirement duplicate

This is the simple formula where there is no duplicate.


Formula#2: all path
We could also recursively parse the graph and authorize duplicate requirements:


Output for the user:
This will allow providing many metrics to the user including 2 major ones:
1) a graph showing the distribution of tests (risk / number of test cases)
This is useful to check the correlation between risk and nb of test cases implemented per test (you do want that the more risky tests are tested the more in details so have the more test cases).

2) more importantly, some "risk-weighted-coverage" statistics
The normal coverage metrics give basic information about how much the requirements are covered but it does consider any requirement/specification with the same “weigth”. the "risk-weighted-coverage" would introduce in the calculation the criticality notion. If a highly critical test is succeeding and a low-criticity test is failing, the risk-weighted-coverage will be much better that the opposite way even though there are only 2 test.
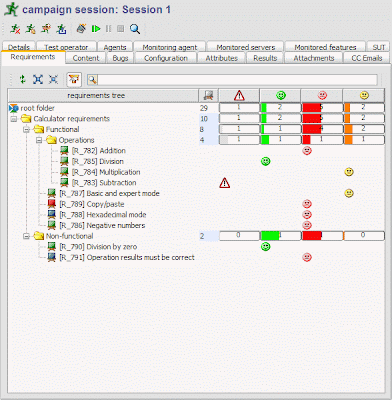
Presentation will be as the standard coverage currently displayed.
Many other metrics might be deliverable to the user (need to think more about it).


